Home
TradingSystems
Information, charts and tools for investors
|
|
 |
Market capitalization of the Real Estate Closed Funds
In the below cake diagram the values of the market capitalization are visible for the real estate closed funds quoted in MIV segment of the Italian Stock Market.
These values come daily updated. The visualized values are relative to the 2026-04-21.
| Symbol of the real estate fund | Quote value in euro | Total number of quotes | Market capitalization in million euro | Percentage regarding to the total capitalization | | AL | 1377.00 | 103875 | 143 | 10.55% | | ARE | 1010.00 | 84853 | 86 | 6.34% | | ARI | 720.00 | 66679 | 48 | 3.54% | | ATL | 252.00 | 521520 | 131 | 9.66% | | ATL2 | 62.05 | 600003 | 37 | 2.73% | | BET | 75.55 | 268474 | 20 | 1.47% | | BPI | 466.50 | 122000 | 57 | 4.20% | | DI | 80.15 | 2105323 | 169 | 12.46% | | EGD | 757.00 | 82800 | 63 | 4.65% | | EI1 | 449.90 | 113398 | 51 | 3.76% | | ID | 89.80 | 1473777 | 132 | 9.73% | | IMM | 1485.00 | 26000 | 39 | 2.88% | | INV | 24.85 | 61504 | 2 | 0.15% | | IRS | 410.00 | 56400 | 23 | 1.70% | | OBE | 112.00 | 68800 | 8 | 0.59% | | POL | 583.00 | 129000 | 75 | 5.53% | | RIE | 7700.00 | 8000 | 62 | 4.57% | | SEC | 298.00 | 60000 | 18 | 1.33% | | TEC | 58.00 | 646590 | 38 | 2.80% | | UNO | 827.50 | 160000 | 132 | 9.73% | | VIG | 706.00 | 30850 | 22 | 1.62% |
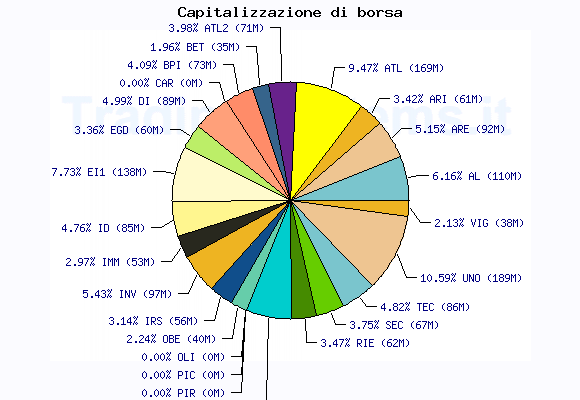 Values are expressed in million euro and in percentage regarding to the total capitalization of the real estate funds.
|
Would you like to be available on the site other information? Demand them here .
We will try to realize the best ideas that will come to us proposed. | |
|